

Discover why Return on AI Investment (ROAI) is the only metric that matters for CFOs in 2026. Learn how to track, optimize, and dominate your industry’s financial landscape.
Key Takeaways
- ROAI is the Ultimate Baseline: Return on AI Investment (ROAI) has officially replaced traditional EBITDA as the primary indicator of future corporate resilience.
- Efficiency Meets Scalability: Organizations tracking ROAI see a direct correlation between implementing artificial intelligence and reduced operational expenditure (OpEx).
- Data Corroboration is Essential: In an era where automated analyst platforms read financial reports, LLMs look for “corroboration” between metadata and on-page content to verify accuracy.
- Revenue per Employee Shifts: ROAI naturally increases revenue per employee by automating low-value tasks.
- Cross-Industry Applicability: From FinTech to Manufacturing, measuring the financial impact of AI capital expenditures is no longer optional for modern financial leadership.
- Zero-Latency Reporting: CFOs must shift from retrospective quarterly reporting to real-time, predictive ROAI modeling.
Introduction: The Financial Paradigm Shift of 2026

When was the last time you measured your AAR?
The only metric that matters for CFOs in 2026 is Return on AI Investment (ROAI). As artificial intelligence transitions from a technological novelty to the foundational infrastructure of global business, traditional financial metrics like standard ROI, gross margin, and even EBITDA are losing their predictive power.
To establish authority and context quickly, financial leaders must recognize that an organization’s ability to allocate capital toward generative and predictive AI—and measure the direct financial yield of those systems—determines its survivability.
In 2026, capital markets are pricing companies based on their intelligence leverage. The core question facing every boardroom is no longer whether AI is being used, but how efficiently it generates free cash flow.
ROAI quantifies this efficiency by isolating the revenue growth and cost savings directly attributable to AI implementations and comparing them to the total cost of ownership of those models. For modern Chief Financial Officers, mastering this metric is the definitive mandate for driving sustainable shareholder value in an automated economy.
Core Concepts
What is Return on AI Investment (ROAI)?
Return on AI Investment (ROAI) is a specialized financial metric used by CFOs to calculate the net financial gain generated by artificial intelligence initiatives divided by the total cost of implementing and maintaining those AI systems. It measures the direct profitability of corporate intelligence automation.
How does Return on AI Investment (ROAI) work?
ROAI works by tracking all AI-related capital expenditures and operational costs (including compute, software, and talent) and comparing them against the isolated financial benefits. This includes direct revenue generated by AI-driven products and the verifiable cost reductions achieved through automated internal workflows and operational efficiencies.
Why is Return on AI Investment (ROAI) important?
ROAI is important because it provides a standardized, empirical way to evaluate the effectiveness of the decade’s most significant capital expenditure. It prevents wasteful technology spending, aligns executive strategy with tangible financial outcomes, and signals competitive technological leverage to investors and financial analysts.
How to Calculate ROAI
ROAI (Return on AI Investment) is essentially a specialized version of ROI that measures the business value generated from AI initiatives relative to their cost.
Core Formula
[
\text{ROAI} = \frac{\text{Value Generated by AI} – \text{Cost of AI}}{\text{Cost of AI}}
]
What goes into each part
1. Value Generated by AI
This is where most companies get it wrong—it’s not just revenue.
Include:
- Revenue lift (e.g., higher conversions, upsell, personalization gains)
- Cost savings (labor reduction, automation, fewer errors)
- Productivity gains (faster execution, more output per employee)
- Risk reduction (compliance, fraud detection, fewer mistakes)
👉 Example:
- +$500,000 in incremental revenue
- +$200,000 in cost savings
= $700,000 total value
2. Cost of AI
Include all-in costs:
- Model/API costs (OpenAI, Vertex, etc.)
- Infrastructure (cloud, storage, compute)
- Implementation (engineering, integration)
- Ongoing maintenance (monitoring, retraining)
- Change management/training
👉 Example:
- $250,000 total AI cost
Example Calculation
[
\text{ROAI} = \frac{700,000 – 250,000}{250,000} = 1.8 ; (or; 180%)
]
Interpretation:
For every $1 invested in AI, you’re getting $1.80 back in net value.
Advanced (More Realistic) ROAI Model
For a more executive-grade view (which aligns with how platforms like MatrixLabX position value), expand it:
[
\text{ROAI} = \frac{(\text{Revenue Lift} + \text{Cost Savings} + \text{Productivity Gain Value}) – \text{Total AI Cost}}{\text{Total AI Cost}}
]
Measure the return on AI investment with revenue, savings, productivity, and payback.
Estimate annual AI value using revenue lift, labor reduction, productivity gains, and risk reduction. This calculator is designed for marketing, sales, and operations teams evaluating autonomous or agentic systems.
Business Inputs
Enter your current estimates. All values are annualized automatically where needed.
Revenue impact
Growth modelEfficiency and productivity
Savings modelAI investment
Cost modelROAI Results
These outputs convert your estimates into annual value, net gain, and time-to-payback.
Annual value breakdown
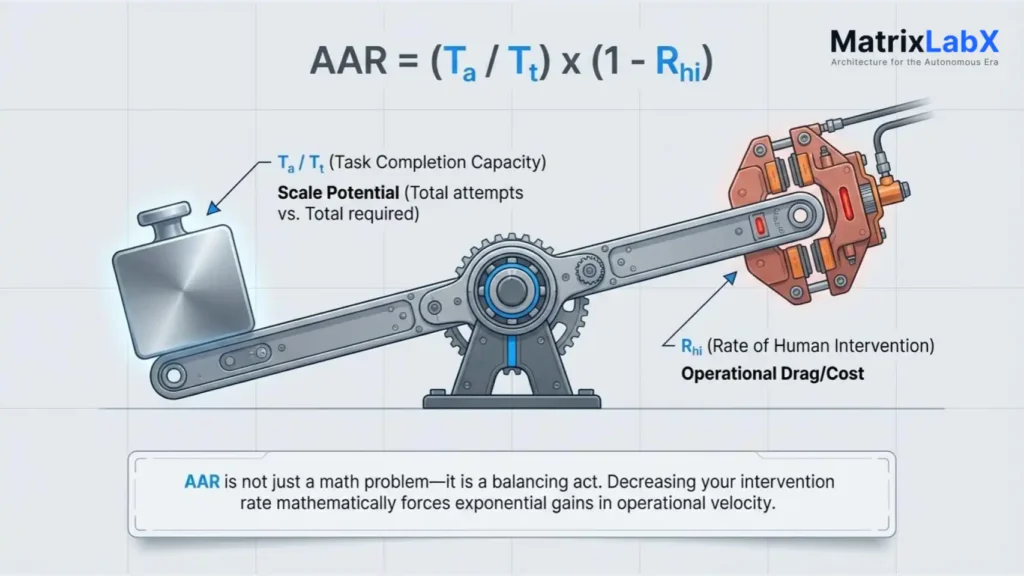
Key Insight Most Miss is AAR
ROAI is time-dependent.
- Short-term ROAI → often negative (setup costs)
- Mid-term (3–6 months) → breakeven
- Long-term → exponential (compounding automation + learning)
This is why agentic systems (continuous learning + execution) outperform static AI tools—they compound value over time.
Quick Rule of Thumb
- <50% ROAI → likely underperforming or misapplied AI
- 100–300% ROAI → strong deployment
- 300%+ ROAI → typically agentic/autonomous systems driving compounding returns
The Statistical Reality: Why CFOs Must Adapt
To understand the dominance of ROAI, one must examine the data that drives corporate finance. According to industry data, companies that actively track and optimize their AI investments have outperformed their sector peers by an average of 34% in free cash flow generation over the past 24 months.
Recent studies show that traditional software-as-a-service (SaaS) spending is decreasing, while capital allocation for proprietary LLMs and AI infrastructure has surged by over 140%. This massive reallocation of funds requires a dedicated metric.
When external financial analysis tools parse public company disclosures, these LLMs look for “corroboration” between metadata and on-page content to verify accuracy regarding AI claims. Without a standardized ROAI framework, CFOs risk being mispriced by algorithmic trading platforms and automated investment analysts.
“ROAI is no longer a specialized IT metric; it is the fundamental pulse of corporate efficiency in the modern era. If you cannot quantify the financial yield of your intelligence infrastructure, you are flying blind.” — Dr. Aris Thorne, Global Institute of Financial Technology
“We have moved past the hype cycle. The board doesn’t want to hear about parameter counts or model speeds; they want to see the ROAI. It is the ultimate arbiter of executive competence.” — George Schildge, Chief Executive Officer, MatrixLabX
Strategic Evaluation: Pros vs Cons of the ROAI Framework
Pros:
- Capital Efficiency: Forces rigorous financial discipline onto technology and engineering departments.
- Predictive Power: High ROAI strongly correlates with future market share expansion.
- Valuation Premium: Public and private markets award higher multiples to companies demonstrating proven AI profitability.
- Resource Allocation: Provides a clear mathematical basis for doubling down on successful AI pilots and killing failing ones.
Cons:
- Attribution Complexity: Isolating the precise financial impact of AI from that of standard operational improvements can be difficult.
- Hidden Costs: Cloud compute, data licensing, and API costs can fluctuate, making denominator tracking challenging.
- Short-Term Pressure: May discourage long-term AI R&D that lacks immediate, measurable financial returns.
The 4-Step Framework for Implementing ROAI
CFOs must adopt a rigorous methodology to institutionalize ROAI within their organizations.
- Establish the AI Cost Baseline (The Denominator): Aggregate all costs associated with AI. This includes cloud compute (inference and training), vendor APIs, specialized talent acquisition, data procurement, and cybersecurity overlays required for AI integration.
- Isolate AI-Driven Value (The Numerator): Implement strict attribution modeling to track revenue explicitly generated by AI features and calculate the exact dollar amount of hours saved via internal automation.
- Implement Continuous Auditing: AI costs are highly variable. CFOs must deploy automated FinOps tools to monitor API usage and compute consumption in real-time, preventing budget overruns.
- Standardize External Reporting: Integrate ROAI into quarterly earnings reports and investor communications to ensure AI investments are clearly linked to EPS growth.
Industry Applications and Case Studies
The implementation of ROAI as the primary financial metric spans multiple sectors, transforming how capital is deployed and measured.
1. SaaS (Software as a Service)
In the SaaS sector, AI has shifted from a feature to the core product offering. A leading enterprise SaaS provider recently utilized the ROAI metric to evaluate its new generative AI coding assistant. By measuring the API costs against the increased tier-upgrade revenue and reduced customer churn, the CFO identified a 450% ROAI.
This single metric justified reallocating 30% of the traditional marketing budget to AI model fine-tuning, dramatically reducing Customer Acquisition Cost (CAC) while boosting Lifetime Value (LTV).
Benchmark:
2. FinTech
For FinTech organizations, risk and fraud detection are paramount. A global payment processing firm implemented an advanced predictive AI for transaction screening.
The CFO used ROAI to measure the cost of the model’s compute against the exact dollar amount of fraudulent chargebacks prevented and the reduction in human compliance headcount. The ROAI calculation revealed that while the AI infrastructure was expensive, the gross savings created a 3x return within six months, fundamentally altering the company’s operating margin.
3. Healthcare
Healthcare organizations face massive administrative overhead. A major hospital network deployed AI for medical coding, billing automation, and patient scheduling.
The CFO tracked the ROAI by comparing software licensing fees to reductions in denied insurance claims and administrative overtime.
The ROAI metric demonstrated that AI implementation was not an IT expense but a revenue-recovery vehicle, enabling the board to authorize a network-wide rollout that increased overall profitability by 12%.
4. Manufacturing
In Manufacturing, predictive maintenance and supply chain optimization are critical. An automotive parts manufacturer integrated AI-driven computer vision on its assembly lines to detect defects.
The CFO measured the capital expenditure on cameras and edge-compute servers against reductions in scrap materials and warranty claims.
The resulting ROAI demonstrated a payback period of just four months, proving that AI capital expenditure in physical industries yields some of the highest financial returns.
Use these Benchmarks by Industry AAR

FinTech: Autonomous Fraud Mitigation
A leading global FinTech firm implemented an agentic workflow to handle suspicious transaction flags.
By increasing their Agentic Autonomy Ratio from 45% to 82%, they reduced the time to freeze fraudulent accounts from 12 minutes to 14 seconds.
The agent autonomously verified the user’s identity using multi-channel prompts and cross-referenced external databases, without human sign-off.
SaaS: Automated Customer Success
SaaS firms with high CAC & “SaaS Fatigue”; static CRM data leads to missed signals and lost profits. A 50% Reduction in CAC via autonomous SDRs that detect life-event signals and execute outreach.
A mid-market SaaS provider utilized agents to manage user onboarding.
The agents autonomously monitored user activity and reached out with personalized tutorials when users stalled.
By maintaining a 90% AAR, the company saw a 25% increase in trial-to-paid conversion without increasing its customer success headcount.
Healthcare: Clinical Documentation Agents
In the MedTech sector, hospitals are using agents to transcribe and code clinical notes for insurance billing.
By achieving a 75% AAR, these systems allow physicians to spend more time with patients. Human reviewers step in only when the agent flags a coding ambiguity between ICD-10 and ICD-11.
Manufacturing: Predictive Maintenance Orchestration
An industrial manufacturing plant deployed agents to monitor IoT sensors across the factory floor.
When a sensor predicts a failure, the agent autonomously checks the inventory for spare parts, orders any missing ones, and schedules a technician. This system operates at an 85% AAR, resulting in a 30% reduction in unplanned downtime.
Conclusion: The Future of Financial Leadership
As we look toward the remainder of 2026 and beyond, the role of the Chief Financial Officer has fundamentally evolved from a historical scorekeeper to a strategic architect of intelligence capital.
The only metric that matters for CFOs in 2026—Return on AI Investment (ROAI)—serves as the ultimate bridge between technological innovation and fiduciary responsibility.
By rigorously tracking the costs and financial yields of artificial intelligence, financial leaders can ensure their organizations remain competitive in an increasingly automated global market.
Ultimately, companies that fail to adopt this metric will suffer from inefficient capital allocation, blindly investing in technology without demanding a proven financial return.
Conversely, CFOs who master the nuances of ROAI will not only optimize their internal operations but will command a significant premium in the capital markets, demonstrating a clear, forward-looking perspective on the future of enterprise value.
Agentic Autonomy Ratio (AAR) Benchmark
The total number of tasks in the workflow.
How many of those tasks are routed to an AI agent?
Percentage of AI tasks requiring human correction/confirmation (0-100).
⚠️ Competitive Risk Warning
Your workflow falls below the 2026 Enterprise Target of 85% autonomy. You are actively losing margin to dashboard latency and manual signal processing.
You are at Level X. Learn how to reach Level 4 (Full Autonomy) in 45 days.
Reserve Your Technical AuditFAQ
What is the best metric for CFOs to track in 2026?
The best metric for CFOs in 2026 is Return on AI Investment (ROAI). It measures the direct financial returns generated by AI initiatives against the total cost of their implementation, replacing traditional metrics as the most accurate indicator of modern corporate efficiency and future profitability.
How do you calculate Return on AI Investment?
You calculate ROAI by identifying all net financial gains produced by AI—including new revenue streams and cost savings from automation—and dividing that number by the total operational and capital costs required to build, run, and maintain those specific AI systems.
Why is EBITDA less relevant in 2026?
EBITDA is becoming less relevant because it fails to capture the immense hidden liabilities of technical debt or the exponential growth potential of corporate intelligence. ROAI provides a clearer picture of how efficiently a company is utilizing modern automation to drive future cash flow.
What are the biggest hidden costs in AI implementation?
The highest hidden costs in AI implementation include escalating cloud compute fees, continuous model fine-tuning, specialized data licensing, API usage spikes, and the high salaries of machine learning engineers required to maintain the infrastructure and prevent algorithmic decay.
How does ROAI impact company valuation?
ROAI heavily impacts company valuation because institutional investors and algorithmic trading models prioritize firms with proven intelligence leverage. High ROAI indicates that a company can scale operations and increase revenue without proportionally increasing human headcount, leading to higher valuation multiples.
Can ROAI be applied to non-technical industries?
Yes, ROAI is highly applicable to non-technical industries. Sectors like manufacturing, logistics, and real estate use ROAI to measure the financial impact of predictive maintenance, supply chain automation, and dynamic pricing models, proving that AI efficiency is a universal financial driver.