500 leads or 100 leads? Why conversion rate beats lead volume in enterprise SaaS
Direct answer: in enterprise SaaS, conversion rate beats lead volume once your sales team reaches capacity. In an illustrative model with $500K deals and five account executives, 100 high-intent leads produced $31.8M in annual net gross profit versus $7.32M from 500 low-intent leads at identical spend. Past capacity, extra leads add zero revenue.
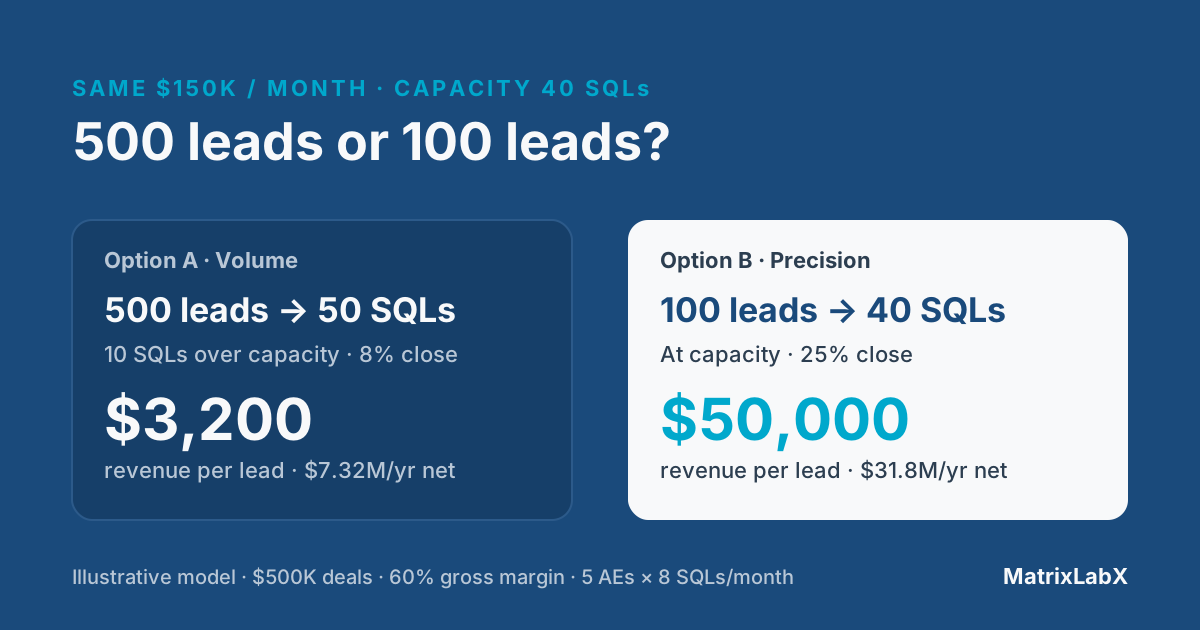
The question every SaaS CRO gets wrong: 500 leads or 100?
Picture the quarterly board meeting. Marketing shows a slide with lead volume up five times. Heads nod. A big number feels like progress, and nobody wants to be the one asking whether it is the right number.
So here is the challenge. Two lead sources cost the same. One delivers 500 leads a month. The other delivers 100. Which would you take?
Most revenue leaders pick the 500 on instinct. In enterprise SaaS, with six-figure deals and a fixed number of account executives, that instinct is usually wrong. The rest of this post shows why, step by step. The model is an illustrative scenario built to make the math visible. It is not client data, and every figure below is an output of its stated assumptions.
The scenario: same budget, two lead sources
Both options share the same fixed assumptions:
- Average deal size: $500,000.
- Gross margin: 60%.
- Sales capacity: five account executives (AEs), each able to work eight SQLs a month, so 40 SQLs a month in total.
- Sales team cost: $40,000 per AE per month, fully loaded, or $200,000 a month.
- Lead spend: $150,000 a month for either option.
| Metric | Option A: Volume | Option B: Precision |
|---|---|---|
| Leads per month | 500 (broad, low intent) | 100 (narrow, high intent) |
| Lead spend per month | $150,000 | $150,000 |
| Lead → SQL rate | 10% | 40% |
| SQLs generated | 50 | 40 |
| SQLs the team can work | 40 (capped) | 40 |
| SQL → close rate | 8% | 25% |
| Closed deals per month | 3.2 | 10 |
| Revenue per month | $1.6M | $5.0M |
| Net gross profit per month | $610K | $2.65M |
| Net gross profit per year | $7.32M | $31.8M |
| Revenue per lead | $3,200 | $50,000 |
The math, step by step
Step 1: SQLs generated vs. sales capacity
Option A converts 10% of 500 leads into 50 SQLs. Option B converts 40% of 100 leads into 40 SQLs. On paper, A wins by 10 SQLs. But the team can only work 40. The extra 10 SQLs in Option A are never worked properly. They sit in a queue, go cold, or get a rushed first call. Both options deliver the same 40 workable SQLs.
Step 2: closed deals
Low-intent SQLs close at 8% in this model, so Option A closes 3.2 deals a month from its 40 worked SQLs. High-intent SQLs close at 25%, so Option B closes 10 deals a month. Same team, same hours, three times the wins.
Step 3: monthly and annual net gross profit
Net gross profit here is revenue times gross margin, minus lead spend and sales team cost.
- Option A: 3.2 deals × $500K = $1.6M revenue. At 60% margin that is $960K, minus $150K lead spend and $200K sales cost, which leaves $610K a month, or $7.32M a year.
- Option B: 10 deals × $500K = $5.0M revenue. At 60% margin that is $3.0M, minus the same $350K in costs, which leaves $2.65M a month, or $31.8M a year.
Identical budget. More than four times the profit.
Step 4: the break-even close rate
What would Option A need to match Option B? Because only 40 SQLs can be worked, A must close 10 deals from 40, which is a 25% close rate, the same as B. Its 500 leads buy no advantage at all. Volume above capacity does not lower the bar; it only adds leads nobody can reach.
Why lead volume stops working: the capacity ceiling
Every sales team has a capacity ceiling: the number of SQLs it can work well in a month. Below the ceiling, more leads mean more revenue. Above it, the extra leads create three costs.
- Lead decay. Buyers who wait for a reply move on. Why the delay builds before anyone sees the lead is covered in speed to lead.
- AE burnout. Reps triage instead of sell. Discovery gets shorter and follow-up gets thinner on every deal, including the good ones.
- Lost opportunities. A real buyer buried in a pile of poor-fit SQLs gets the same rushed treatment as the rest.
Inside the ceiling, close rate is the lever. In this model, every one point of close rate on 40 SQLs is worth 0.4 deals, or $200K a month in revenue. Revenue per lead tells the same story: $3,200 for Option A versus $50,000 for Option B. Revenue per SQL worked is $40,000 versus $125,000.
Could Option A hire its way out? Working all 50 SQLs takes seven AEs at eight SQLs each. At an 8% close rate, that yields 4 deals, $2.0M in revenue, and $1.2M in gross profit. After $150K in lead spend and $280K for seven AEs, net is $770K a month. That is still about $1.9M a month short of Option B. Hiring adds fixed cost to a conversion problem, a pattern covered in how to fix declining SaaS sales without hiring more reps.
What this means for SaaS revenue teams
Measure revenue per lead and revenue per sales hour, not MQL count
MQL count rewards volume. Revenue per lead and revenue per sales hour reward fit. Put both on the board slide next to lead volume, and the 500-versus-100 debate settles itself. The fully loaded cost behind each sales hour is broken down in the true cost of a seven-person SDR team.
Re-score lead sources on SQL-to-close, not lead-to-MQL
A source that fills the top of the funnel can still lose money once AE time is counted. Rank every source by its trailing SQL-to-close rate and revenue per lead, then move budget toward the sources that close. A scoring model reps trust is the starting point; see how to build a B2B lead scoring model. To find the stage where your own pipeline leaks first, run the five-point pipeline leak diagnostic.
Align marketing and sales comp to conversion, not volume
If marketing is paid on MQLs and sales on closed revenue, the two teams are paid to want different lead sources. Pay marketing on sourced pipeline that closes, or on revenue per lead, and both teams chase the same 100 leads. Pricing your own vendors on outcomes rather than seats follows the same logic; see the shift from per-seat to outcome-based pricing.
Run your own pipeline math with MatrixLabX.
The free Autonomous Audit Report (AAR) is a read-only assessment of a sample of your own CRM and pipeline data. It shows conversion by stage and source, where capacity runs out, and what governed digital workers would prepare, with every projected figure labeled as modeled. A MatrixLabX solution architect replies within 48 hours to arrange the sample.
Get your free AAR Benchmark →How autonomous AI agents raise conversion without adding headcount
The model makes one point plain: when capacity is fixed, the way to grow revenue is to raise the quality of what reaches your AEs. That is the work PrescientIQ™ is built for. Its agents work as a coworker, not a copilot: they do the research and preparation, and a named person on your team decides.
- Qualify and rank. Scout, the Pipeline Research Analyst, researches accounts and ranks them against your ideal customer profile and buying signals, so the queue an AE sees holds fewer, better-fit accounts.
- Route. Marshal, the Revenue Operations Coordinator, hands each account to the right next step, so high-intent accounts reach a rep while they are still in market.
- Engage under approval. Herald, the Outbound Engagement Rep, drafts outreach for those accounts. Outbound drafts are held for a named person's approval before they reach a prospect.
- Record. Every action is recorded to an audit ledger: what was done, why, and who approved it.
Your team chooses how much oversight each kind of action gets. The two governance modes are:
Human-in-the-loop (HITL). The action is drafted and held. It does not execute until a named person on your team approves it.
Human-on-the-loop (HOTL). The action executes under a standing policy your team sets. A named person supervises and keeps intervention, override, and revocation authority.
Your team chooses the mode for each action class, based on its risk tolerance, and can change it at any time.
Every action, in either mode, is recorded to the audit ledger with its rationale, before-and-after state, and the approver or policy behind it.
Every action class starts in human-in-the-loop until your team changes it.
How to set the right mode for each revenue action is covered in human-in-the-loop vs. human-on-the-loop for revenue actions. For the broader model of agents as accountable labor, start with what digital labor is.
Frequently asked questions
- Is more leads always better for SaaS companies?
- No. More leads help a SaaS company only while the sales team has room to work them. Once SQLs exceed what account executives can handle, extra leads go stale, burn rep time, and add no revenue. Past that point, the close rate on the SQLs your team can actually work decides the result.
- How do you calculate revenue per lead?
- Revenue per lead is closed revenue from a lead source divided by the number of leads that source produced in the same period. In the illustrative model in this post, 500 leads that close $1.6 million return $3,200 per lead, while 100 leads that close $5 million return $50,000 per lead.
- What is a good SQL-to-close rate in enterprise SaaS?
- There is no single good SQL-to-close rate in enterprise SaaS, because deal size, cycle length, and how strictly a team defines an SQL vary widely. The useful benchmark is your own trailing close rate by lead source. Rank sources by it, and fund the sources that close, not the ones that fill the top of the funnel.
- How does sales capacity affect lead generation ROI?
- Sales capacity sets a ceiling on lead generation ROI. A team of five account executives who can each work eight SQLs a month can work 40 SQLs, no more. Every lead dollar that produces SQLs above that ceiling is wasted unless you add capacity, so ROI depends on conversion within the ceiling.
- When does lead volume actually matter more than conversion rate?
- Lead volume matters more than conversion rate when the sales team has spare capacity and deals are small enough to close quickly. A team working below its ceiling gains revenue from each added SQL. Volume also matters early in a new market, when you need enough deals to learn which segments convert.
- How can AI agents raise conversion rate without adding sales headcount?
- AI agents raise conversion rate by improving what reaches the sales team rather than adding volume. In PrescientIQ, agents research and rank accounts against your ideal customer profile, so account executives spend their fixed hours on better-fit accounts. Outbound drafts are held for a named person to approve, and every action is recorded to an audit ledger.
Conclusion: take the 100 leads
Lead volume is a vanity metric once your team hits its capacity ceiling. In this model, the same $150,000 a month buys $7.32M a year in net gross profit as 500 low-intent leads, or $31.8M as 100 high-intent ones. The difference is not effort or spend. It is close rate on the SQLs your team can actually work.
Take the 100 leads. Then measure revenue per lead, re-score every source on SQL-to-close, and pay both teams for conversion. Run the same math on your own CRM data before you set next year's lead budget.
Where the data runs
PrescientIQ is hosted and operated by MatrixLabX on Google Cloud. SOC 2, ISO 27001, and PCI DSS attestations are held by Google Cloud, which operates the underlying infrastructure. They are not MatrixLabX certifications. MatrixLabX application-layer SOC 2 is in progress.
Related reading
Notes on this page
Every figure on this page is an input or output of one illustrative model: $500,000 average deal, 60% gross margin, five AEs working eight SQLs each a month at $40,000 fully loaded per AE per month, and $150,000 a month in lead spend for either option. Conversion rates are assumptions chosen to show the mechanism, not benchmarks or client results. The model is steady-state and ignores sales-cycle lag. This page states no MatrixLabX performance figures; any projected impact for your company is modeled on your own data in the Autonomous Audit Report and labeled as a target until validated.
See where your own execution effort is going
The Autonomous Audit Report models where your team's execution capacity is currently spent, what your configuration is actually paying for, and what the governed alternative looks like on your own data — before any commitment.
Get your free AAR benchmark