Can you trust your forecast? A five-point pipeline leak diagnostic for mid-market SaaS
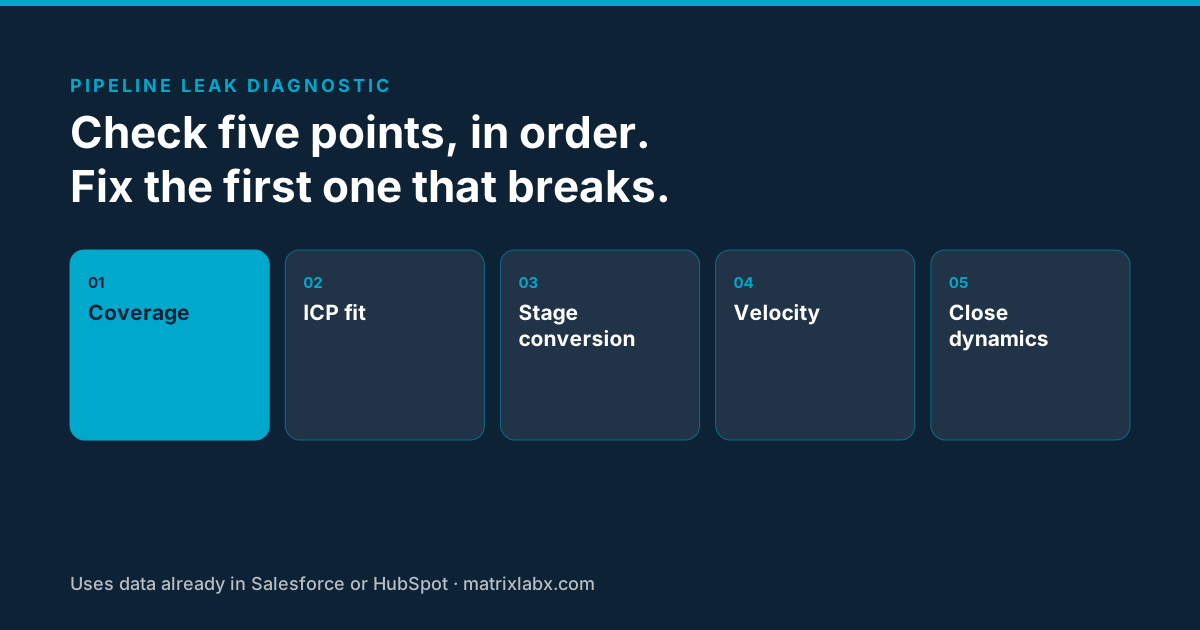
Short answer: when mid-market SaaS sales decline, the problem is almost never “not enough activity.” It is a leak at one specific stage that nobody can see early enough. Measure five things, in order: coverage, ICP fit, stage conversion, velocity, and close dynamics. The first one that breaks is where you fix first.
Why does the forecast feel like guesswork when sales decline?
You are not alone if your forecast call feels like guesswork. Gartner reported in February 2020 that less than 50% of sales leaders and sellers have high confidence in their organization’s forecasting accuracy. When bookings are falling, that blind spot stops being an annoyance and becomes the reason the board loses patience.
The diagnostic below is built for $20M–$500M ARR revenue teams. It uses data already in Salesforce or HubSpot, so no new tool is needed to start.
What are the five points of the pipeline leak diagnostic?
| Point | What to measure | It breaks when | Where the fix sits |
|---|---|---|---|
| 1. Coverage | Bookings target ÷ trailing four-quarter win rate, against qualified pipeline created | Qualified pipeline is short of what the target needs | Targeting at the top of the funnel |
| 2. ICP fit | Win rate of in-ICP vs. off-ICP open opportunities | A large share of pipeline is off-ICP | Tighter ICP; stop counting off-ICP deals in coverage |
| 3. Stage conversion | Stage-to-stage conversion, last four quarters | One stage dropped more than the others | Messaging (early), value (mid), or buying committee (late) |
| 4. Velocity | Days since the last meaningful buyer action | Deals or trials sit with no buyer activity | Act on stalls the day they happen |
| 5. Close dynamics | Closed-lost and slipped deals coded by reason | “No decision” and discounting rise | A value case built on metrics the CFO owns |
1. Coverage: is there enough pipeline to hit the number?
Divide next quarter’s bookings target by your trailing four-quarter win rate. That is the pipeline you need. Compare it to qualified pipeline created for that quarter, not total pipeline.
If coverage is short, the leak is at the top. Adding more reps to a short pipeline only spreads the same opportunities thinner.
2. ICP fit: is the pipeline you have winnable?
Pull every open opportunity and tag it in or out of your ideal customer profile: segment, size, tech stack, buying trigger. Then compare win rates for the two groups. If your ICP is a slide rather than a set of CRM fields, start with how to define a B2B ideal customer profile from won, lost, and churned deals.
In declining quarters, reps chase off-ICP deals to protect their number. Those deals inflate coverage, eat cycle time, and close at a fraction of the rate. If a large share of your pipeline is off-ICP, your coverage figure from step one is overstated.
3. Stage conversion: where do deals stop moving forward?
Calculate stage-to-stage conversion for the last four quarters and look for the stage that dropped the most. That single number tells you whether you have a messaging problem (early stages), a value problem (mid stages), or a buying-committee problem (late stages).
4. Velocity: how long do deals sit before anyone acts?
For each open opportunity, measure days since the last meaningful buyer action, not the last rep email. Stalled deals are where forecasts break. A deal with no buyer activity in two cycles of your normal stage duration should not be in commit. How much the response delay itself costs is broken down stage by stage in speed to lead.
For product-led motions, run the same test on trial accounts: which trials stalled before their key value event, and did anyone reach them at that moment?
5. Close dynamics: why are late-stage deals slipping?
Review the last two quarters of closed-lost and slipped deals. Code each one: competitor, no decision, budget or CFO block, or timing. Rising “no decision” and deeper discounting usually mean the business case is not surviving the CFO, which is a different fix than losing to a competitor.
What should you do with the result?
The first stage that fails is your priority. Fixing three stages at once dilutes the team that is already stretched.
- Coverage or ICP fit breaks: tighten targeting to accounts showing real buying signals, and stop counting off-ICP deals in coverage.
- Conversion or velocity breaks: act on stalls the day they happen, with follow-up grounded in what the buyer actually did.
- Close dynamics break: rebuild the value case around the metrics a CFO owns.
The hard part is not knowing this. It is doing it every day, for every account, with a team that is already behind. If the answer is not more hiring, read how to fix declining SaaS sales without hiring.
Find your leak with your own numbers.
The free Autonomous Audit Report (AAR) is a read-only assessment of a sample of your CRM and pipeline data. A MatrixLabX architect maps where your pipeline leaks and models the P&L impact on your own baseline before you commit to anything. It is returned within 48 hours.
Get your free AAR Benchmark →How does PrescientIQ™ keep the diagnostic running?
A diagnostic run once a quarter finds the leak after the quarter is lost. PrescientIQ™ runs the same checks continuously with governed digital workers:
- Scout, the Pipeline Research Analyst, scores accounts against your ICP from intent signals and CRM data, so off-ICP deals stop inflating coverage.
- Herald, the Outbound Engagement Rep, drafts trigger-grounded outreach for the accounts Scout surfaces. Each draft is held until a named person on your team approves it.
- Guide, the Trial Activation Specialist, flags trial accounts that stall before their key value event and prepares an activation sequence at that moment.
- Marshal, the Revenue Operations Coordinator, routes work across the crew, and every action is recorded to the audit ledger, so you can see what happened to each account, not just what was reported.
Your team chooses how much oversight each kind of action gets. The two modes are:
Human-in-the-loop (HITL). The action is drafted and held. It does not execute until a named person on your team approves it.
Human-on-the-loop (HOTL). The action executes under a standing policy your team sets. A named person supervises and keeps intervention, override, and revocation authority.
Your team chooses the mode for each action class, based on its risk tolerance, and can change it at any time.
Every action, in either mode, is recorded to the audit ledger with its rationale, before-and-after state, and the approver or policy behind it.
Every action class starts in human-in-the-loop until your team changes it.
The full specification of the crew is on the Revenue Accelerator Stack page. Prefer the long read first? The Death of Software Seats white paper (PDF, no form) sets out the argument.
Where the data runs
PrescientIQ is hosted and operated by MatrixLabX on Google Cloud. SOC 2, ISO 27001, and PCI DSS attestations are held by Google Cloud, which operates the underlying infrastructure. They are not MatrixLabX certifications. MatrixLabX application-layer SOC 2 is in progress.
Frequently asked questions
- What is a pipeline leak?
- A pipeline leak is the stage in a sales process where qualified opportunities stop converting at their historical rate. In mid-market SaaS it is usually one stage, not all of them, which is why a stage-by-stage diagnostic finds it faster than a review of total pipeline or rep activity.
- How do I know if my sales forecast is unreliable?
- Compare the forecast you called in week three of each of the last four quarters with the actual result. If the gap is large, or always misses in the same direction, the forecast rests on rep judgment rather than buyer behavior, and the pipeline leak diagnostic will show where it breaks.
- How much pipeline coverage does a mid-market SaaS team need?
- Required pipeline coverage is next quarter’s bookings target divided by your trailing four-quarter win rate. Compare that figure with qualified pipeline created for the quarter, not total pipeline. If qualified pipeline is short, the leak is at the top of the funnel, and adding reps will not fix it.
- Why do off-ICP deals make declining sales worse?
- Off-ICP deals inflate pipeline coverage, consume cycle time, and close at a lower rate than deals that match your ideal customer profile. In declining quarters reps chase them to protect their number, so the forecast looks healthier than it is until those deals slip or are lost.
- Do I need new software to run a pipeline leak diagnostic?
- No. All five measures of the pipeline leak diagnostic, coverage, ICP fit, stage conversion, velocity, and close dynamics, come from data already in Salesforce or HubSpot. Software matters when you need to act on the findings every day, for every account, with a team that is already stretched.
- How does the free Autonomous Audit Report help find a pipeline leak?
- The free Autonomous Audit Report is a read-only assessment MatrixLabX runs on a sample of your own CRM data. It maps where your pipeline leaks, which signals went unworked, and what governed digital workers would have done, and it is returned within 48 hours of your request.
Related reading
Notes on this page
The one third-party figure is Gartner’s, dated and linked to its source. The five-point diagnostic is MatrixLabX’s own method. This page states no MatrixLabX performance figures; any projected impact for your company is modeled on your own data in the Autonomous Audit Report and labeled as a target until validated.
See where your own execution effort is going
The Autonomous Audit Report models where your team's execution capacity is currently spent, what your configuration is actually paying for, and what the governed alternative looks like on your own data — before any commitment.
Get your free AAR benchmark