How to build a B2B lead scoring model your reps trust and an agent can act on
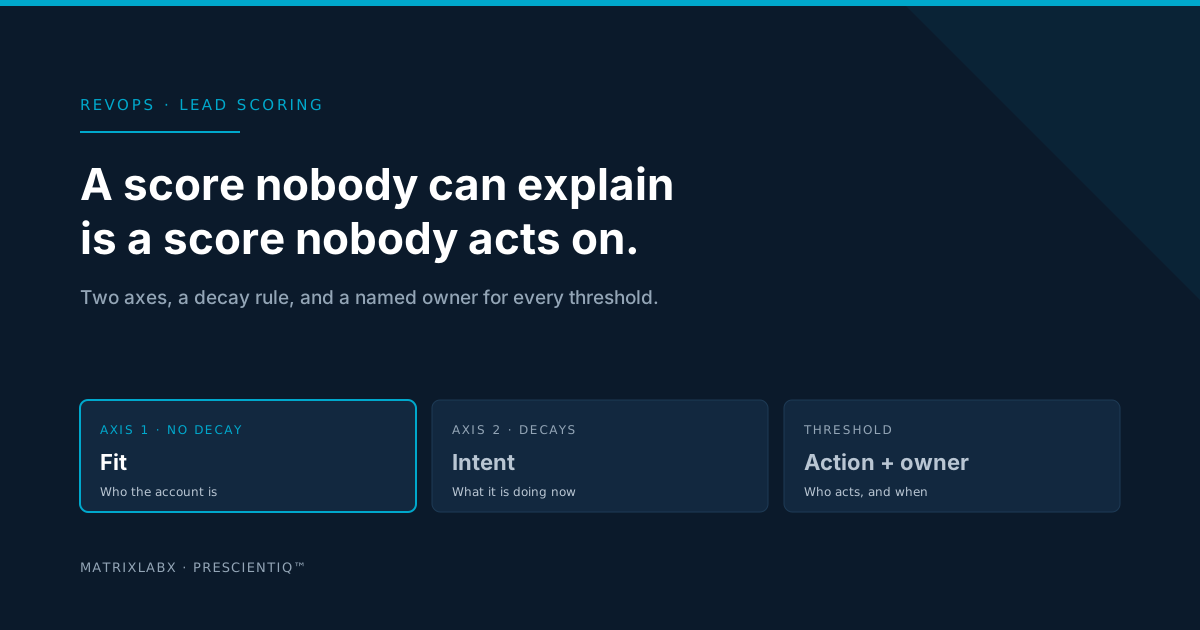
A B2B lead scoring model ranks accounts by how likely they are to become revenue. Build it on two separate axes: fit (who the account is, which does not decay) and intent (what it is doing now, which decays as it ages). Choose signals by comparing your own won and lost deals, tie every threshold to an action and a named owner, and back-test before launch. If an automated system will act on the score, it also has to be reproducible: the same inputs must give the same number.
Most revenue teams already have a lead score. It lives in a CRM field, it was set up by someone who has since left, and the reps sort by it about as often as they sort by fax number. When they are asked why, the answers are consistent: the high scores were not ready to buy, the score never explains itself, and a student who downloaded four ebooks outranks a director who visited pricing once.
None of that is a reason to stop scoring. It is a reason to build the model differently. This guide covers the six steps, a worked example you can copy, a decision tree for choosing between rules, predictive, and a hybrid, and the one requirement that changes when an AI agent, not a rep, is the one acting on the score.
Why most lead scores get ignored
Lead scores fail in four predictable ways, and each one is a design choice rather than a data problem.
- One number for two questions. “Is this the right account?” and “Is it buying now?” have different answers and different plays. A single total averages them away.
- No reason attached. A rep who cannot see which signals produced a score cannot use it to open a conversation, so it gets ignored.
- No decay. Points accumulate forever, so old activity keeps accounts at the top of the list long after the interest has passed.
- No owner per threshold. Crossing a line triggers nothing in particular, so nothing in particular happens.
The handoff is where this shows up. If marketing and sales do not share a definition of a qualified account, the score becomes the argument instead of the answer; the revenue leakage playbook covers the shared dictionary that has to come first.
Rules, predictive, or a deterministic hybrid
There are three ways to produce the number. The choice depends on how much clean deal history you have and on who, or what, will act on the result.
| Approach | How it works | Strength | Weakness | Fits when |
|---|---|---|---|---|
| Rule-based | Points assigned by hand to attributes and actions | Transparent; a rep can read the reason | Weights are opinions and drift as the market moves | Little deal history; starting from nothing |
| Predictive | A statistical model trained on past outcomes | Finds patterns no one would write as a rule | Needs a large, clean history; hard to explain a single score | High deal volume and a data team to maintain it |
| Deterministic hybrid | Explicit weights, calibrated against your won and lost deals, computed by code | Explainable and reproducible; same inputs, same score | Needs a recalibration schedule someone owns | Mid-market volume, or an automated system acts on the score |
A score is a description of an account. What to do about it is a separate decision, and most stacks stop at the description. The difference is laid out in buyer intelligence vs. decision intelligence.
Build the model in six steps
Define the outcome the score predicts
Pick one event downstream of the handoff: an opportunity created, or a deal won within a set window. Do not score toward "MQL". An MQL is the output of a score, so scoring toward it is circular, and it lets the model look accurate while pipeline stays flat.
Agree the definitions first: the shared MQL/SQL/PQL dictionary →
Split fit and intent into two axes
Fit is who the account is: industry, size band, technology stack, whether a named owner for the problem exists. Intent is what the account is doing: pricing-page visits, research surges, replies, event attendance. Keep them as two numbers. One combined total cannot tell a rep whether to call now or wait.
Choose signals from your own won and lost deals
Pull the last several quarters of closed-won and closed-lost opportunities. For each candidate signal, compare how often it appears in the won set against the lost set. Keep the signals that separate them. Drop the ones that appear equally in both, however intuitive they feel.
Check the inputs: why CRM data decays faster than your cleanup cycle →
Weight the signals and decay intent
Give the strongest separators the most points and cap each axis, so no single signal can carry an account on its own. Fit does not decay: an account stays in your industry. Intent must decay: a pricing-page visit last week means something, the same visit two months ago means very little.
Tie every threshold to an action and a named owner
A threshold with no action attached is a dashboard color. For each band, write down what happens and who does it: route to a rep within a day, enroll in a nurture track, qualify by a cheaper channel, or suppress. If nobody owns the action, the score is decoration.
Back-test, then recalibrate on a schedule
Score last quarter’s accounts with the new model and check that conversion rises band by band. If a lower band converts as well as a higher one, the weights are wrong. Recalibrate on a fixed schedule and whenever the ICP, pricing, or product changes, and version every change so scores stay comparable.
The ratio metrics that tell you whether the handoff is working →
A worked example (illustrative)
The points, decay windows, and thresholds below are examples to show the mechanics, not recommended values. Your own weights come from step 3. Each axis is capped at 50.
| Signal | Points |
|---|---|
| Industry inside your ICP | 15 |
| Employee band inside your ICP | 10 |
| Runs a CRM you integrate with | 10 |
| Named owner for the problem (for example, a RevOps lead) | 15 |
| Signal | Points |
|---|---|
| Pricing-page visit | 15 |
| Third-party research surge on your category | 15 |
| Reply to outreach | 10 |
| Event or webinar attendance | 10 |
Decay rule: an intent signal earns full points for 7 days, half points from day 8 to day 30, and nothing after day 30. Thresholds: fit of 30 or more is high fit; intent of 20 or more is high intent.
| Account | Fit | Intent | Single total | Quadrant and play |
|---|---|---|---|---|
| Account A | 35 Industry 15 + band 10 + CRM 10 + no named owner 0 | 22.5 Research surge this week 15 + pricing visit 10 days ago 7.5 + webinar 45 days ago 0 | 57.5 | High fit · high intent Route to a rep now |
| Account B | 10 Industry 0 + band 0 + CRM 10 + no named owner 0 | 25 Pricing visit 3 days ago 15 + reply 5 days ago 10 | 35 | Low fit · high intent Qualify by a cheaper channel |
| Account C | 50 All four fit signals present | 5 Webinar 20 days ago 5 | 55 | High fit · low intent Watch and nurture |
Look at the single-total column. Accounts A and C land within three points of each other, 57.5 and 55, and a one-number model would route both to a rep today. Only A is buying. C is a strong account that went quiet three weeks ago; calling it now spends a rep’s time and the account’s patience. Two axes make that difference visible. One total hides it.
Fit and intent: four quadrants, four plays
Act now
High fit · high intent
Route to a rep or to outbound within a day, with the signals that produced the score attached so the first message can reference them.
Watch
High fit · low intent
The right account at the wrong moment. Nurture it and watch for intent continuously, so the change is caught the week it happens, not at the next list refresh.
Qualify cheaply
Low fit · high intent
Real activity, wrong profile. Qualify through self-serve, a short form, or a low-cost channel before any account executive time is spent.
Suppress
Low fit · low intent
Remove from active sequences. Every touch here costs sender reputation and rep attention and buys nothing.
The high-fit, low-intent quadrant is where most pipeline is lost quietly. Those accounts are on the target list, nobody is watching them weekly, and the month their intent rises is the month nobody looked. Coverage of that quadrant, not volume against the top one, is what the sales process coverage metric measures.
Which scoring approach fits your team?
Answer for the team you have today, not the one in the plan.
Rules, predictive, or a deterministic hybrid?
When an agent acts on the score, reproducibility stops being optional
A rep can ignore a bad score. An agent acts on it, for every account, every time it runs. That raises the bar in three ways. The score has to be reproducible: two identical accounts scored a week apart get the same number. It has to be explainable: the signals behind it travel with it. And it has to be recorded, so that when an action looks wrong, someone can see what the score was and why.
This is why asking a language model to produce a priority score is the wrong design. Language models are good at reading and drafting; they are not built to return the same arithmetic twice. Scout, the Pipeline Research Analyst, scores accounts against your ICP from intent signals, CRM records, and web telemetry. Account scoring runs on sandboxed deterministic code. No language model performs arithmetic that has a numeric consequence, so a score can be reproduced and checked. Qualified accounts go to Herald, the Outbound Engagement Rep, whose drafts carry the signal that produced them.
What happens next is your team’s call. Your team chooses the mode for each action class, based on its risk tolerance, and can change it at any time. Human-in-the-loop (HITL): The action is drafted and held. It does not execute until a named person on your team approves it. Human-on-the-loop (HOTL): The action executes under a standing policy your team sets. A named person supervises and keeps intervention, override, and revocation authority. Every action, in either mode, is recorded to the audit ledger with its rationale, before-and-after state, and the approver or policy behind it. The trade-offs of each mode for revenue actions are covered in human-in-the-loop vs. human-on-the-loop.
Scoring is the first stage of the loop, not the whole of it. The four agents and their coordinator are specified on the Revenue Accelerator Stack page, and why most AI agents stop at top of funnel covers what breaks when a score hands off to a tool that cannot see what happens next.
How to tell whether your model is working
Three checks, run monthly, tell you more than any dashboard color.
- Conversion by band. Opportunity creation should rise from each band to the next. A flat line means the weights are not separating anything.
- Rep acceptance. Track how often reps accept or reject routed accounts, and why. Rejections with a reason are the cheapest calibration data you will get.
- Time to first touch in the act-now quadrant. A correct score acted on next week is a missed one. If this number is long, the problem is capacity, not the model.
The ratio and latency metrics behind those checks are covered in which SDR metrics actually predict pipeline.
Frequently Asked Questions
- What is a lead scoring model?
- A lead scoring model is a set of rules or a statistical model that ranks leads and accounts by how likely they are to become revenue. A useful B2B model scores two things separately: fit, meaning how closely the account matches your ideal customer profile, and intent, meaning how actively it is researching a purchase right now.
- What is the difference between fit and intent in lead scoring?
- Fit describes who the account is: industry, size, technology stack, and buying structure. It changes slowly and should not decay. Intent describes what the account is doing: pricing-page visits, research activity, replies. It changes weekly and should decay as it ages. Combining both into one number hides which one is driving the score.
- Is predictive lead scoring better than rule-based scoring?
- Not by default. Predictive scoring can find patterns rules miss, but it needs a large history of won and lost deals, and its output is hard to explain to a rep. Rule-based scoring is transparent but drifts as markets change. Most mid-market teams do best with explicit weights calibrated against their own closed deals.
- How often should a lead scoring model be recalibrated?
- Recalibrate a lead scoring model on a fixed schedule, typically each quarter, and whenever your ideal customer profile, pricing, or product changes. Check whether conversion still rises with each score band. If a lower band converts as well as a higher one, the weights are wrong. Log every change so scores stay comparable.
- Why do sales reps ignore lead scores?
- Sales reps ignore lead scores they cannot explain or that have sent them bad leads before. A score that gives no reason, mixes fit with intent, or never decays loses credibility fast. Reps trust a score when they can see which signals produced it and when high scores reliably turn into real conversations.
- Can an AI agent act on a lead score?
- Yes, if the score is reproducible and explainable. An agent acts at volume, so a wrong score becomes many wrong actions. In PrescientIQ, Scout scores accounts with deterministic code, so identical inputs produce identical scores, and records the signals behind each one. Outreach drafted from that score follows the governance mode your team sets.
Related Reading
Notes on this post
The six steps are MatrixLabX’s working method for mid-market B2B teams. The worked example’s signals, points, decay windows, and thresholds are illustrative and are not recommended values. No third-party statistic is quoted, and no conversion, accuracy, or pipeline outcome is claimed. Product statements match the current public copy.
See where your own execution effort is going
The Autonomous Audit Report models where your team's execution capacity is currently spent, what your configuration is actually paying for, and what the governed alternative looks like on your own data — before any commitment.
Get your free AAR benchmark