Which SDR Metrics Actually Predict Pipeline?
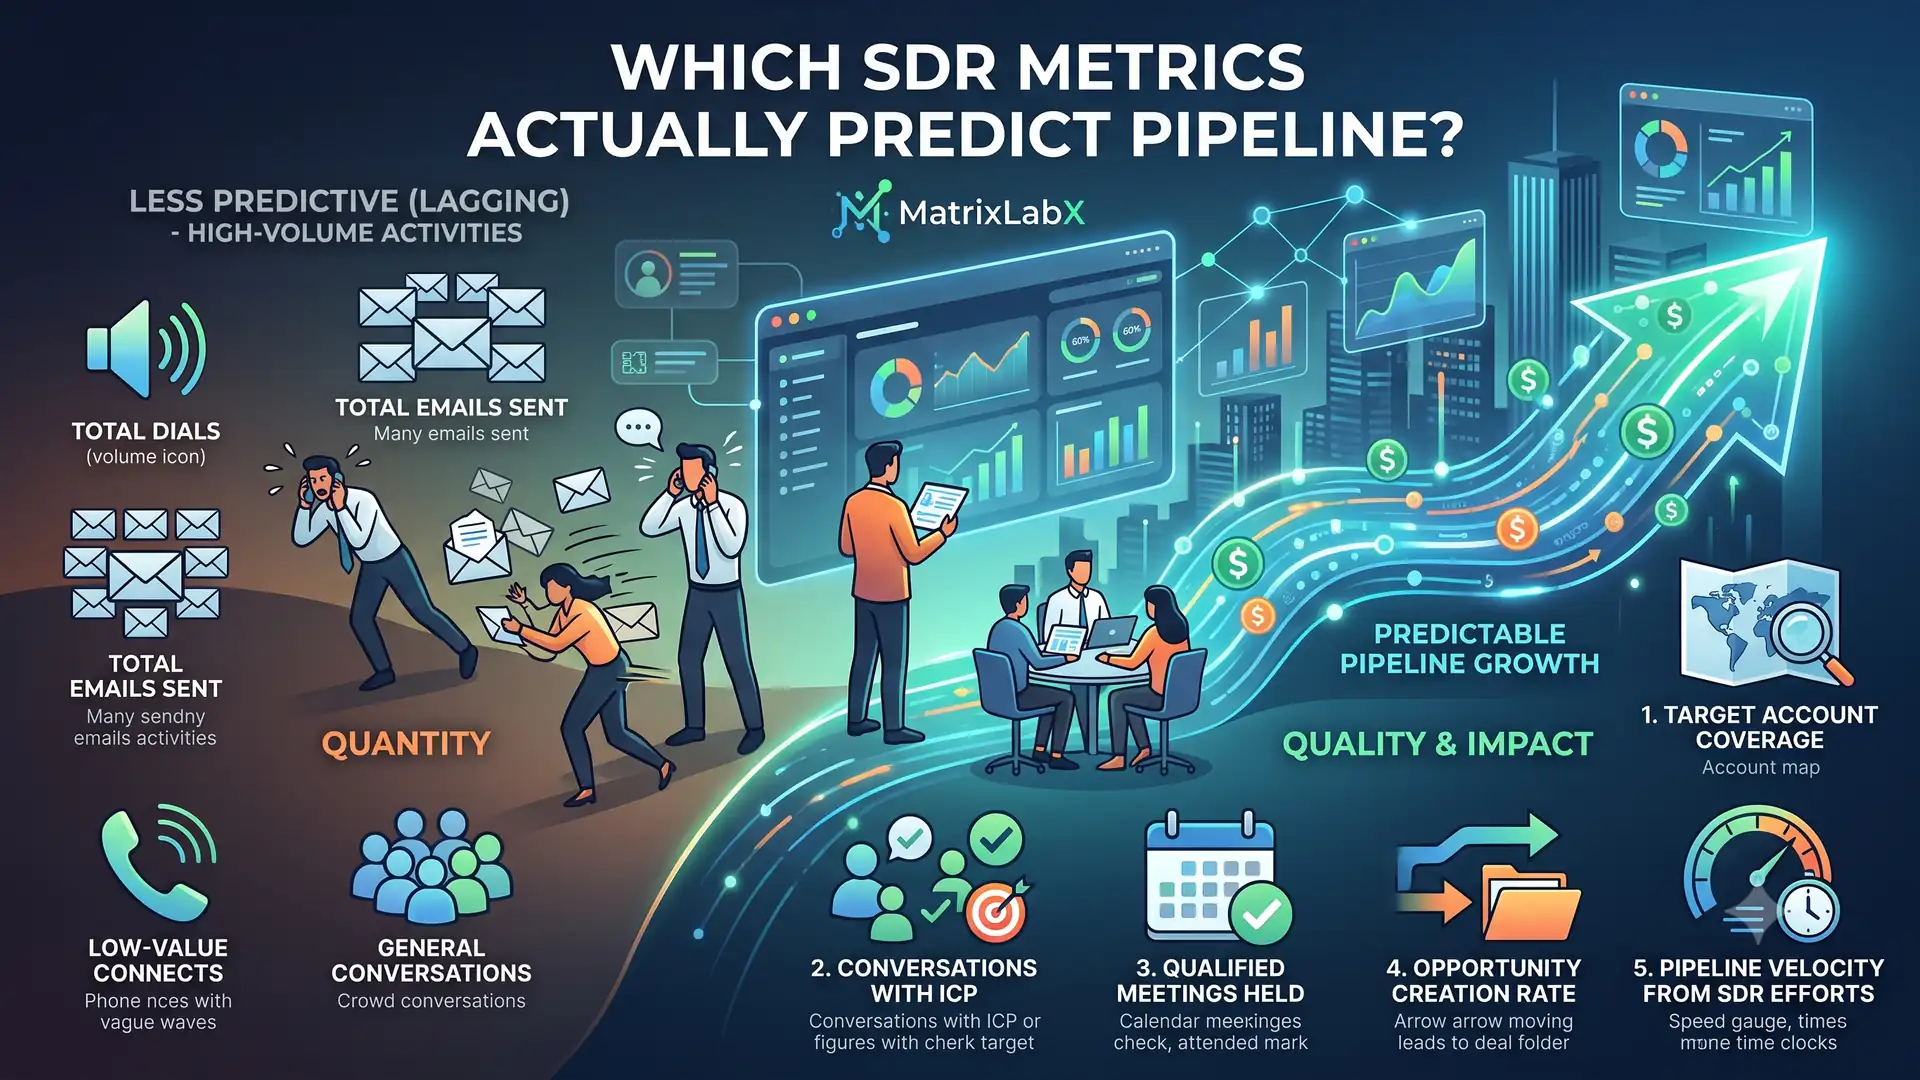
Volume metrics — calls placed, emails sent, touches logged — measure effort, and effort is the thing a rep can always produce more of on demand. The metrics that predict pipeline are ratios and latencies: reply rate, meeting-accepted rate, speed to first touch, and the share of a working set that got touched at all. When a volume metric rises and a ratio metric falls, you are watching capacity run out in real time.
Why do activity metrics mislead?
Because they are the metrics a rep can move by trying harder, which makes them the metrics a rep will move when they are being measured on them.
Ask for more touches and you will get more touches. The minutes have to come from somewhere, and they come from research — the step that makes a touch relevant. So volume goes up and reply rate goes down, and total meetings booked stays flat or falls. The dashboard shows a more productive team producing less.
This is why volume metrics are worth tracking as inputs and useless as targets. They tell you what was spent. They don't tell you what it bought.
Which SDR metrics predict pipeline?
Four, roughly in order of diagnostic value:
1. Speed to first touch. Elapsed time between a lead arriving and the first human or agent contact. This is the single most actionable SDR metric because it is almost purely a coverage measure — it reflects whether someone was available when the signal fired, not whether anyone tried hard. When it degrades, you have a capacity problem, and it degrades exactly when volume spikes. For where that time actually goes, stage by stage, see speed to lead.
2. Reply rate (not open rate). The share of contacted prospects who respond. It's the cleanest available proxy for whether outreach is relevant, and it moves inversely to volume-per-rep in a way that makes the trade-off visible. Track it per-sequence and per-segment; a blended number hides everything interesting.
3. Meeting-accepted rate, not meetings booked. The share of booked meetings the account executive accepts as genuinely qualified. Meetings booked is a volume metric wearing a ratio's clothing — it can be inflated by lowering the qualification bar, and it usually is when quota pressure arrives. Acceptance rate is where that inflation shows up.
4. Working-set coverage. The share of the assigned account list that received any touch in the period. This is the metric that reveals leakage most directly: accounts sitting in a rep's list, sourced and enriched and never contacted, because the hours ran out. It is rarely on a dashboard and it is frequently the largest single source of wasted acquisition spend.
What do these tell you together?
The combinations are the diagnosis:
| Pattern | What it means |
|---|---|
| Volume up, reply rate down | Research is being cut to hit volume — you are at the capacity ceiling |
| Speed to first touch degrading at peaks | Coverage is sized for average, not peak, inbound |
| Meetings booked up, acceptance rate down | Qualification bar is slipping under quota pressure |
| Coverage below 100% and stable | Structural leakage — accounts are being paid for and never worked |
| All four flat while headcount grows | Ramp drag — see SDR ramp time |
None of these are performance problems in the sense of a rep underperforming. All four are capacity problems, and they respond to capacity fixes rather than to coaching.
What should you measure instead of activity?
The larger shift — from counting human activity to measuring how much of the buyer's process the system can carry — is the argument we make in sales process coverage. This post is the rep-level diagnostic layer underneath it: these four metrics are how you detect a capacity ceiling before it shows up in a missed quarter.
How does governed digital labor move these numbers?
Directly, and on the two that are purely coverage measures.
Speed to first touch and working-set coverage are constrained by whether execution capacity was available when the signal fired. Agent execution isn't bounded by business hours or by minutes-per-account, so those two metrics stop being a function of staffing level.
Reply rate and meeting-accepted rate are different — they depend on relevance and judgment, which is why the human approval gate matters rather than getting in the way. Agents propose and execute within guardrails; a person holds approval on what actually goes out; every action lands on an immutable audit ledger. Agents execute, humans authorize.
Which of these four is actually your constraint is an empirical question about your funnel, not a general one. The Autonomous Audit Report models it against your own data. The platform is PrescientIQ™; the broader thesis is digital labor.
These metrics only mean something if the accounts reaching reps were ranked well in the first place. The upstream half is how to build a B2B lead scoring model your reps trust.
Frequently asked questions
What is the most important SDR metric?
Speed to first touch, for most teams. It is close to a pure coverage measure, it degrades predictably when capacity is exceeded, and it is directly actionable.
Why is meetings booked a bad target?
Because it can be raised by lowering the qualification bar. Meeting-accepted rate — the share the account executive accepts as qualified — catches that inflation.
Should SDRs be measured on activity at all?
Track activity as an input for diagnosis, not as a target. Setting volume targets reliably trades research quality for touch count, which lowers reply rate.
What is working-set coverage?
The share of a rep’s assigned accounts that received any touch in a period. Coverage well below 100% means accounts are being sourced and paid for but never worked — usually the largest hidden leak in a development team.
How often should these be reviewed?
Weekly for the ratios and latencies, so a degradation is caught inside the quarter it starts. Monthly review catches capacity problems only after they’ve already cost a quarter’s pipeline.
See where your own execution effort is going
The Autonomous Audit Report models where your team's execution capacity is currently spent, what your configuration is actually paying for, and what the governed alternative looks like on your own data — before any commitment.
Get your free AAR benchmark