Net revenue retention in SaaS: what moves it, where it leaks, and how to run it as an operating system
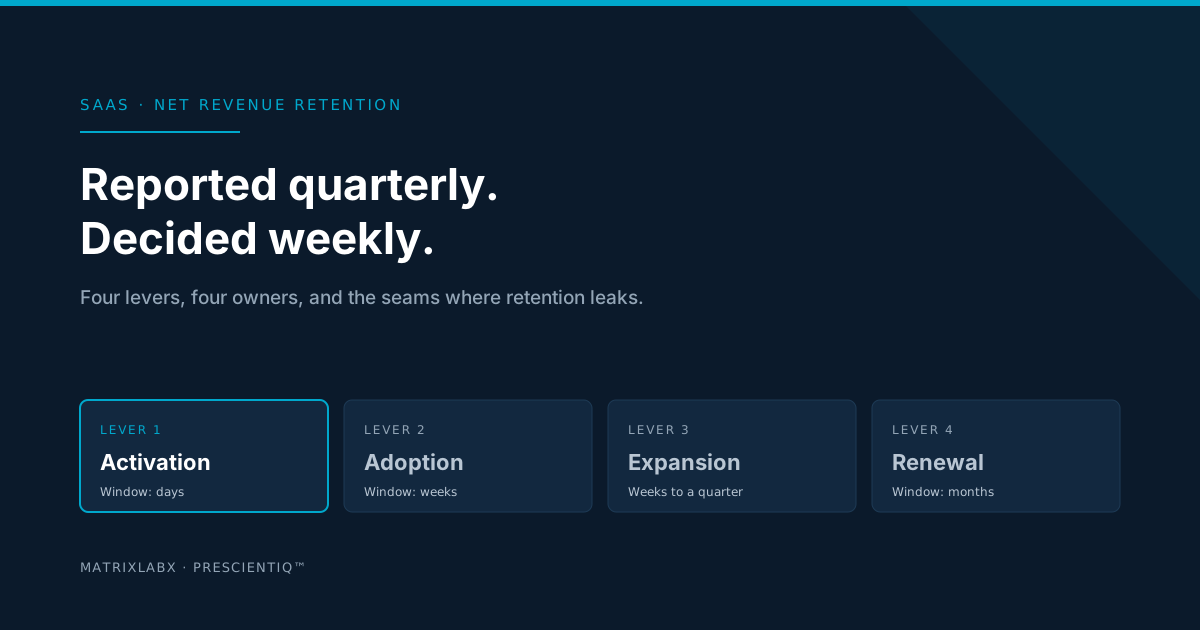
Net revenue retention (NRR) is the share of recurring revenue a SaaS company keeps from its existing customers over a period, after expansion, contraction, and churn. It is reported quarterly and decided weekly: four levers move it (activation, adoption, expansion, renewal), each owned by a different team, and it leaks at the handoffs between them. This guide gives the formula, the levers, the seams, a weekly operating cadence, and a decision tree for which lever to pull first.
Ask a SaaS leadership team what their net revenue retention is and you will get a number to one decimal place. Ask what moved it last quarter and the room goes quiet. NRR is the best single measure of whether a subscription business compounds, and it is almost always managed as a result rather than as a process: calculated after the quarter closes, explained in the board deck, and then left alone until the next close.
This guide treats NRR the other way round. The number is the output of four levers, each with an owner, a signal, and a window in which acting still matters. Run those weekly and the quarterly number stops being a surprise. It is written for CROs, customer success leaders, and RevOps at mid-market SaaS companies, and it deliberately quotes no industry benchmark: the comparison that matters is your own cohort, last year against this year.
The formula, and the number it hides
Take the recurring revenue from a fixed cohort of customers at the start of a period. Add what that cohort expanded by. Subtract what it contracted by and what churned. Divide by where you started. New-customer revenue is excluded; that is the point of the metric.
NRR = (starting ARR + expansion − contraction − churned ARR) ÷ starting ARR
GRR = (starting ARR − contraction − churned ARR) ÷ starting ARR
A worked example, with round numbers chosen to make the arithmetic obvious. They are illustrative, not a benchmark.
| Line | Illustrative value | What it is |
|---|---|---|
| Starting ARR from the cohort | $1,000,000 | Customers active twelve months ago |
| Expansion | + $150,000 | More seats, usage, or products from that cohort |
| Contraction | − $40,000 | Downgrades and seat reductions |
| Churned ARR | − $80,000 | Customers from the cohort who left |
| Ending ARR from the cohort | $1,030,000 | New customers are excluded |
In this example NRR is 103 percent: the cohort is worth slightly more than a year ago. But gross revenue retention, which gives no credit for expansion, is 88 percent. Twelve percent of the base leaked, and expansion from the accounts that stayed covered it. Both statements are true. Only one of them appears on most board slides.
The four levers, in the order a customer meets them
Retention is not one motion. It is four, and they belong to different teams, show up in different systems, and give you very different amounts of time to respond.
Activation
Owner: Growth, onboarding · Window to act: Days- The signal
- Did the account reach its first value event, and how long did it take?
- Where it leaks
- A trial or new account stalls before value and nobody acts until the exit survey or the first invoice dispute.
Adoption
Owner: Customer success, product · Window to act: Weeks- The signal
- Breadth (teams, seats active) and depth (features used) against the plan they bought.
- Where it leaks
- One team uses one feature. The account looks healthy on logins and has no reason to renew at the price it pays.
Expansion
Owner: Account management, sales · Window to act: Weeks to a quarter- The signal
- Usage approaching a plan limit, a second team adopting, a new use case appearing.
- Where it leaks
- The moment passes because nobody pre-built the case. Expansion waits for the renewal conversation.
Renewal
Owner: Customer success, finance · Window to act: Months- The signal
- Sponsor change, declining logins, support tone, procurement contact.
- Where it leaks
- Churn is discovered at the renewal date, when the decision was made a quarter earlier.
Two things stand out. The windows shrink as you move up the list: a renewal gives you months, an activation stall gives you days. And the earlier levers decide the later ones. An account that never activated properly does not adopt, an account that does not adopt has nothing to expand, and the renewal conversation inherits all of it. Most retention programs start at the bottom of this list, because that is where the revenue event is. The leverage is at the top.
Where NRR leaks: the seams, not the teams
None of the four teams is failing at its own job. Retention leaks at the handoffs. Sales closes and hands the account to onboarding with the context in a CRM note. Onboarding declares go-live and hands it to customer success. Customer success meets the account at the quarterly review. Meanwhile the signals that predict churn and expansion are in product analytics, moving weekly, and nobody with an account relationship is watching them at that rhythm. We mapped the same pattern across the whole funnel in how revenue leaks between marketing, sales, and customer success; post-sale is simply where it costs the most, because the revenue is already on the books.
The practical consequence is a timing gap. Signals move months before the renewal date. The review cadence is quarterly. So the typical account owner learns about a churn risk when there are weeks left, and about an expansion moment after it has passed. Which signals move, and how far ahead, is the subject of the companion post: SaaS churn signals: what to watch and when.
Running NRR as an operating system
Turning a lagging number into a managed one takes three rhythms, each answering a different question. The quarterly number is the last of them, not the only one.
| Rhythm | The view | The question | Owner |
|---|---|---|---|
| Weekly | Accounts whose signals moved | Which accounts changed, what play is prepared, who owns it? | CS and account leads |
| Monthly | Cohort retention by segment | Which lever is the weakest for which segment? | RevOps |
| Quarterly | NRR and GRR, board view | Did the weekly work move the number, and what changes next quarter? | CRO, CFO |
The weekly review is the one most teams do not have
It is short and it is specific. Not a health-score dashboard, but a list: these accounts’ signals moved this week, this is the play prepared for each, this is who owns it. The constraint is capacity. A customer success manager with forty accounts cannot read forty usage profiles every week and rebuild context for each one, which is why the weekly review usually does not exist and the quarterly one does.
Where digital labor fits
In the reading and the preparation, not the judgment. Watching every account’s usage continuously, scoring a change, and preparing the play with its reasoning is work an agent can do for every account every day. Deciding whether to offer a discount, escalate to an executive, or let an account go is not. In PrescientIQ, Guide (the trial conversion agent) covers lever one: it watches in-product behavior, flags accounts that stall before their value event, and prepares the activation sequence at that moment. Steward (the expansion agent) covers levers two to four: it analyzes post-sale usage to flag expansion opportunities and churn-risk signals early, and prepares the play for the account owner between quarterly reviews, not at them. Any customer-facing message either one prepares is held for a named person’s approval. Account scoring runs on sandboxed deterministic code. No language model performs arithmetic that has a numeric consequence, so a score can be reproduced and checked. Every action, in either mode, is recorded to the audit ledger with its rationale, before-and-after state, and the approver or policy behind it.
Which lever do you pull first?
Four questions about your own cohort. The answer is usually not the lever with the biggest dollar figure attached.
Where should your retention work start?
Modeling it on your own cohort
The free Autonomous Audit Report is a P&L projection built on your own data in a read-only working session. Every figure in it is labeled as modeled. For a SaaS company that means your own cohort, your own usage signals, and which of the four levers the leak sits on, before any commitment. The PrescientIQ for SaaS page covers how the platform maps to a SaaS funnel end to end, and the AI readiness self-score tells you in ten minutes whether your team is ready for agents to touch any of it.
PrescientIQ is hosted and operated by MatrixLabX on Google Cloud. SOC 2, ISO 27001, and PCI DSS attestations are held by Google Cloud, which operates the underlying infrastructure. They are not MatrixLabX certifications. MatrixLabX application-layer SOC 2 is in progress.
What this guide does not claim
It quotes no industry benchmark for NRR or GRR; published figures vary by segment, contract size, and how the cohort is defined, and the comparison that matters is your own cohort over time. The worked example is arithmetic, not a result. It does not claim a retention outcome for any product, including ours. And it does not claim that software makes the retention decisions: the discount, the escalation, and the choice to let an account go stay with your team.
Frequently Asked Questions
- What is net revenue retention in SaaS?
- Net revenue retention (NRR) is the percentage of recurring revenue a SaaS company keeps from an existing cohort of customers over a period, after adding expansion and subtracting contraction and churn. It answers one question: if you sold nothing new, would revenue from the customers you already have grow or shrink?
- How do you calculate net revenue retention?
- NRR equals starting recurring revenue from a cohort, plus expansion, minus contraction, minus churned revenue, divided by the starting recurring revenue. New-customer revenue is excluded. Measure it on a fixed cohort over twelve months, and report gross revenue retention beside it so expansion cannot hide churn.
- What is the difference between net revenue retention and gross revenue retention?
- Gross revenue retention (GRR) counts only what you kept: starting revenue minus contraction and churn, with no credit for expansion, so it can never exceed 100 percent. Net revenue retention adds expansion back. GRR shows how leaky the base is; NRR shows whether expansion outruns the leak. Read them together.
- What are the main levers for improving net revenue retention?
- There are four, in the order a customer meets them: activation, getting a new account to its first value event; adoption, widening and deepening use; expansion, converting adoption into more seats, usage, or products; and renewal, keeping the contract. Each has a different owner, a different signal, and a different window to act.
- Why does net revenue retention leak between teams?
- Because each lever has a different owner and the signals live in different systems. Sales hands off at close, onboarding hands off at go-live, and customer success meets the account at the quarterly review. Usage signals that predict churn or expansion sit in product analytics, where nobody with an account relationship is watching them weekly.
- How often should a SaaS company review retention signals?
- Weekly, at the account level, with a monthly cohort view and a quarterly board number. Churn and expansion signals move months before a renewal date; a quarterly review sees them too late to act. The weekly review is short: which accounts moved, what play is prepared, and who owns it.
- Where do AI agents fit in a net revenue retention program?
- In the reading and the preparation, not the judgment. An agent can watch usage for every account continuously, score a change, and prepare the play with its reasoning for the account owner. In PrescientIQ, Guide does this for trial activation and Steward for expansion and retention, and any customer-facing message is held for a named person’s approval.
Related Reading
Notes on this post
The NRR and GRR formulas are the standard definitions; companies differ on cohort and period, so state yours when you report. The worked example uses illustrative round numbers. No third-party benchmark is quoted. Product statements match the current public copy on the pricing and Revenue Accelerator pages. The quotation is George Schildge’s, in a form he supplied for this series.
See where your own execution effort is going
The Autonomous Audit Report models where your team's execution capacity is currently spent, what your configuration is actually paying for, and what the governed alternative looks like on your own data — before any commitment.
Get your free AAR benchmark