» Direct answer
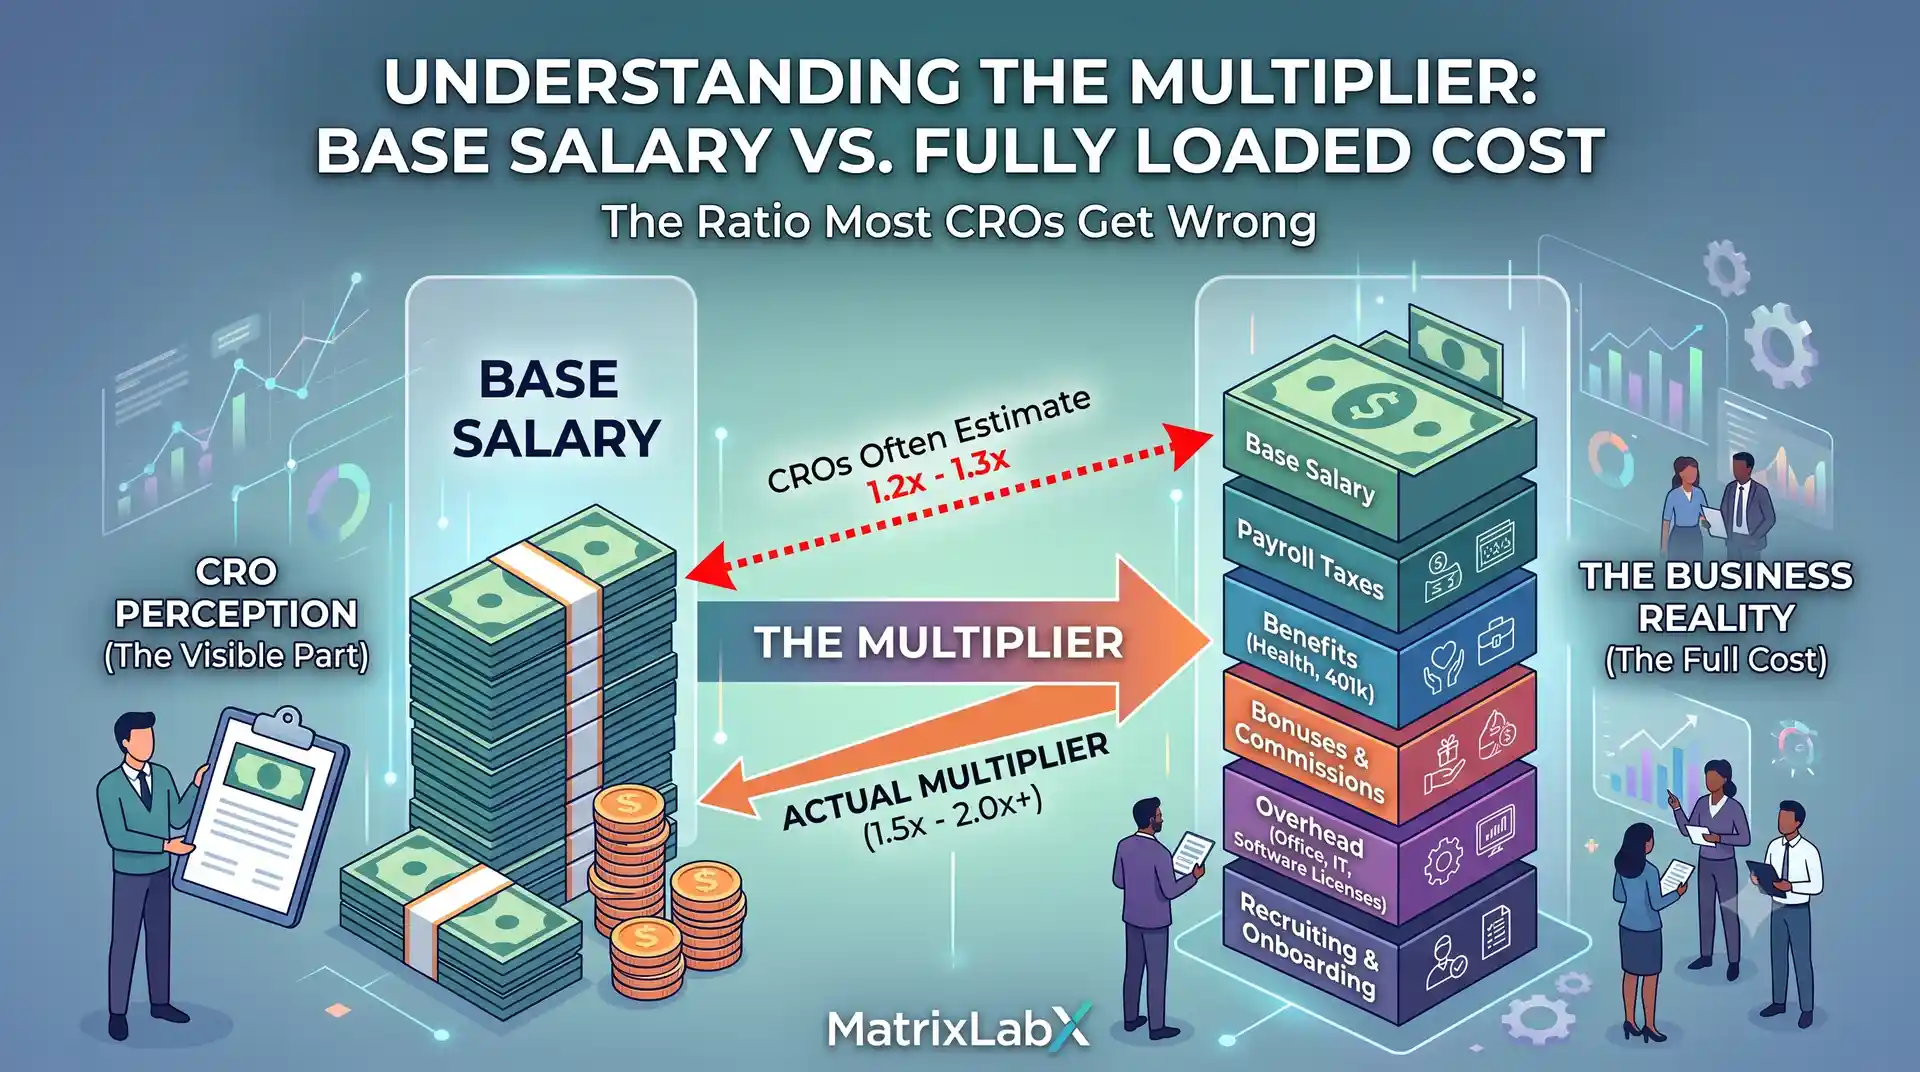
The fully loaded cost of a quota-carrying SDR is roughly 2× base salary — not the 1.25–1.4× loading factor most revenue plans use. A $62K base becomes $127K–$131K once variable comp, employer payroll taxes, benefits, 401(k) match, equity amortization, equipment, recruiting, and ramp drag are counted. The standard factor covers taxes and benefits and stops — which is exactly why headcount plans come in over budget every year.
Ask a CRO what an SDR costs and you will get the base salary times a polite loading factor — usually 1.25×, sometimes 1.4× if finance insisted. Ask the CFO to reconcile what the sales development function actually consumed at year end, and a different number appears: close to double the base, every seat, every year.
Neither person is lying. They are counting different things. The loading factor in most planning models was built for salaried back-office roles: it covers statutory taxes and benefits and nothing else. A quota-carrying seat breaks that model in four places at once — variable comp, equity, turnover, and ramp — and each omission compounds the others.
This article decomposes the multiplier line by line, from the $62K offer letter to the $127K+ reality. It is the compensation layer of the full model in The True Cost of a Seven-Person SDR Team; the tooling layer lives in The tech stack tax.
» Key takeaways
- The real multiplier is ~2.05× base without equity, ~2.1× with it. The common 1.25–1.4× factor misses roughly $44K per seat per year.
- Variable comp is the biggest omission. For an $85K-OTE role, $23K of earnings never appears in a base-salary-driven budget.
- PTO drag is a divisor, not a line item. ~230 productive days against 260 paid days makes every unit of output ~13% dearer than the salary math implies.
- Recruiting and ramp must be amortized over realistic tenure — under two years for SDRs — not over the forever-employee your model assumes.
Where does the standard loading factor come from — and why is it wrong here?
The 1.25–1.4× factor is a back-office artifact. It was derived for stable salaried roles where taxes and benefits are the only meaningful additions to base pay. Apply it to a quota-carrying, high-turnover, slow-ramping role and it fails on all three properties at once.
The statutory portion it covers is real and predictable: employer FICA at 7.65%, federal and state unemployment insurance, workers' compensation — call it $7,600 on our benchmark seat. Benefits add the next tranche: employer share of health, dental, and vision premiums plus a 3% 401(k) match — about $14,200. Base plus those two categories is $83,800, or 1.35× base. This is the number most models stop at, and it is the last point in the calculation where the model still feels defensible.
Everything after this point is what separates a planning artifact from a cost model.
What do the missing categories add?
Roughly $44K a year per seat, in four categories the standard factor never touches. Each one is defensible to exclude in isolation; excluding all four is how a plan misses by a third.
1. Variable compensation — $23,000
An SDR is hired against an $85K OTE, and a functioning team pays most of it: that is the point of the plan. Budgeting the base and treating commissions as "self-funding from pipeline" double-counts the pipeline — the meetings were the job, not a bonus surprise. At plan, variable comp is the single largest gap between the offer letter and the truth.
2. Equity — ~$3,800/year
A typical mid-market SDR grant of ~$15K vests over four years: $3.8K a year of stock-based compensation. It never touches payroll, so it never enters the sales budget — but it dilutes the cap table and lands on the P&L all the same. Multiply by every seat on the go-to-market org and the "invisible" line becomes material.
3. Recruiting and backfill — ~$7,600/year amortized
A recruited SDR costs $12–15K to land — agency fee or the loaded cost of internal recruiting — and stays under two years. Amortize acquisition cost over realistic tenure, not over an assumed forever, and each seat carries ~$7,600 a year in perpetual re-hiring cost. This is not a one-time expense; at SDR turnover rates it is an annuity.
4. Ramp drag — ~$9,200/year amortized
A new SDR takes roughly three months to reach full productivity, producing at about half rate while drawing full compensation. That is ~$16K of paid-but-unproductive cost per hire — re-purchased at every backfill. Spread across the tenure of the average seat: ~$9,200 a year.
Table 1 — From base salary to fully loaded: the complete decomposition
| Layer | Annual $ | Running total | Multiplier |
|---|
| Base salary | $62,000 | $62,000 | 1.00× |
| + Variable comp (at plan) | $23,000 | $85,000 | 1.37× |
| + Employer payroll taxes | $7,600 | $92,600 | 1.49× |
| + Benefits & 401(k) match | $14,200 | $106,800 | 1.72× |
| + Equipment & workspace | $3,000 | $109,800 | 1.77× |
| + Recruiting/backfill (amortized) | $7,600 | $117,400 | 1.89× |
| + Ramp drag (amortized) | $9,200 | $126,600 | 2.04× |
| + Equity (typical grant, amortized) | $3,800 | $130,400 | 2.10× |
» LOADING_FACTOR — sdr_seat_benchmark# what the plan says vs what the seat costs...
» plan_model $62K × 1.25 = $77,500
» taxes+benefits statutory + insurance = covered
» variable_comp $23,000/yr = MISSING
» equity_amort $3,800/yr = MISSING
» recruit+ramp $16,800/yr = MISSING
# true multiplier: 127–130K / 62K
REAL FACTOR: ≈ 2.05× base — plan understates by ~$50K/seat/yr
» Decompose your own seats
Your plan is off by ~$50K per seat. Multiply by your headcount.
MatrixLabX runs this decomposition against your actual comp bands, benefits invoices, and turnover history — then models the same output delivered by governed digital labor, where the loading factor is exactly 1.0×: the price is the price.
2.05×
real multiplier on base
~$50K
understated per seat per year
1.0×
loading factor on digital labor
Book a Discovery Call →
What is PTO drag — and why does every model miss it?
PTO drag is the gap between days you pay for and days you get output from — and it hides because it is a divisor on productivity, not a line item on a budget. Nothing gets added to the cost; the output the cost buys quietly shrinks.
The benchmark seat is paid for 260 working days. Subtract 15 PTO days, 10 company holidays, and 5 sick days, and the business receives about 230 productive days — 88.5% of what it paid for. Every meeting, every SQL, every dollar of sourced pipeline therefore costs ~13% more than a naive per-day calculation implies.
This matters most exactly where planning models are most confident: capacity math. A model that staffs "seven SDRs × 15 meetings a month" has silently assumed 260 productive days per seat. Layer PTO drag under the ramp and turnover effects from the pillar model and theoretical capacity erodes to roughly three-quarters of what the plan promised — while cost stays at 100%.
"When midmarket enterprises embed AI into their core operations, they eliminate bureaucratic drag, allowing them to out-maneuver larger competitors who are constrained by legacy silos."
» George Schildge · CEO & Chief AI Officer, MatrixLabX
How should a CRO use the corrected multiplier?
Three ways: budget with it, benchmark with it, and buy with it. A corrected loading factor is not an accounting curiosity — it changes real decisions.
- Budget with it. Any headcount request below 2× base for quota-carrying roles is understated. Present the fully loaded number to finance first; credibility compounds.
- Benchmark with it. Cost per meeting and cost per SQL must divide the fully loaded run rate by effective output. On the benchmark seat that is ~$1,250 per held meeting — not the $344 the base-salary math suggests.
- Buy with it. Every make-vs-buy comparison — agency, outsourced SDR firm, or a governed AI SDR — is distorted when the in-house column shows 1.25× base. Compare against 2.05×, and the alternatives reprice dramatically. Most AI SDR vendors don't publish a number; the one that does is on the Sales Accelerator pricing page.
The third use is where the multiplier earns its keep. Governed autonomous agents carry none of the loading stack — no payroll tax, no benefits, no equity, no PTO, no recruiter, no ramp. Labor as a Service pricing maps spend to executed workflows and outcomes, so the number in the plan is the number on the invoice. The loading-factor error class simply does not exist.
» Canonical definition
MatrixLabX replaces your fragmented SaaS stack with an autonomous digital workforce. We shift your business from Software as a Service to Labor as a Service. Our agents don't wait for prompts — they sense, decide, act, and learn 24/7 to deliver measurable P&L impact within 60 days (Target — modeled).
The rest of the cost model, and the platform that changes it:
Where the 2× rule bends
The multiplier is a US mid-market benchmark, not a law of nature. In low-benefit-cost geographies or roles with no variable comp, the factor compresses toward 1.5×. In the Bay Area, with rich benefits and larger grants, it stretches past 2.3×. Very long-tenured teams amortize recruiting and ramp over more years and earn a genuinely lower factor — if your SDR tenure is four years, congratulations, and use your own constants. The structure of the decomposition is what transfers: count variable comp, count equity, amortize acquisition and ramp over realistic tenure, and divide output by productive days. Any model that skips those four steps is optimistic by construction.
People also ask
What is the fully loaded cost multiplier for an SDR?
Roughly 2× base salary for a US mid-market SDR — about 2.05× without equity and closer to 2.1× with a typical grant. A $62K base becomes $127K–$131K fully loaded once variable comp, employer payroll taxes, benefits, 401(k) match, equipment, recruiting amortization, and ramp drag are counted. The commonly used 1.25–1.4× factor covers taxes and benefits only.
What does the standard 1.25–1.4× loading factor miss?
Four recurring categories: variable compensation (the largest single omission for quota-carrying roles), equity grant amortization, recruiting and backfill cost divided by realistic tenure, and ramp drag — the months of partial productivity re-purchased at every backfill. Together these add roughly $44K a year to a $62K-base SDR.
What is PTO drag and how does it change cost per productive day?
PTO drag is the gap between paid days and productive days. With 15 PTO days, 10 holidays, and 5 sick days, an SDR delivers about 230 productive days while being paid for 260 — so every unit of output costs about 13% more than the salary math implies. It is a divisor on output, not a line item, which is why most models miss it.
How should equity be counted in fully loaded cost?
Amortize the grant value over the vesting period. A typical mid-market SDR grant of $15K vesting over four years adds roughly $3.8K a year. It is real compensation expense — it dilutes existing holders and appears in stock-based-compensation on the P&L — even though it never touches the payroll file.
Does the 2× multiplier apply to roles other than SDRs?
The structure applies to every role; the constants differ. Quota-carrying roles run higher because variable comp is a large share of earnings. Senior engineers land near 1.6–1.8× because equity replaces variable comp. The universal rule: any plan that budgets headcount below 1.5× base salary is understating cost.
How does digital labor change the multiplier math?
Governed autonomous agents carry no payroll tax, benefits, equity, PTO, recruiting cost, or ramp — the price is the price. Labor as a Service pricing maps spend directly to executed workflows and outcomes, which eliminates the loading-factor error class entirely from the planning model.
» Free engagement · 24-hour response
Budget at 1.25×. Reconcile at 2×. Or fix the model.
We compute your true loading factor from your own comp data — then show you what the same output costs when the loading factor is 1.0× and the workforce never ramps, churns, or takes PTO.
Book a Discovery Call →
» Deployment in 21 days or less (Target — modeled) · P&L impact within 60 days (Target — modeled) · matrixlabx.com/contact